In Agile development, I wanted to understand the metrics that are helpful in grasping the current state of products and organizations, so I undertook thorough research by reading top-ranking websites of Google searches like 'agile KPI.' After reading about 20, the material had started to exhaust the same topics, so I organized it.
Furthermore, in the following, I am using Agile development and Scrum development with nearly the same meaning, but I kindly request that you not take offense.
Metrics and KPI
Metrics and KPI are often used interchangeably. In this material, they are explained as follows.
 View Slides by Gaetano Mazzanti on Slideshare
- Metric: A measurement tool for quantitative assessment, control, and enhancement of processes, products, and teams, or a combination thereof.
- KPI: A metric strongly tied to strategic objectives, possessing at least one time-bound goal.
As a method for setting KPIs, it’s referring to well-known criteria such as "SMART" and "INVEST."
Now, I will proceed to introduce the metrics mentioned on each site.
They are roughly categorized into "development capability," "progress," "process," and "quality," although there are some that span multiple categories.
Development Capability
The metrics that can measure a team's development capability are as follows:
- Velocity
- Cycle Time
- Mean Time to Repair (MTTR)
Velocity
The amount of work completed within a sprint.
The amount of work varies on the estimation size, the story points, or depending on the team.
One of the purposes of measuring velocity is to know the amount of development we can accomplish in a given time frame and enhance the accuracy of estimations. As you proceed through multiple sprints, you can expect the velocity to become stable. If there is a declining trend, it might be a sign of problems like inefficiencies in the development process or deteriorating code maintainability.
Cycle Time
Average time taken to complete tasks. It's treated as the counterpart concept of "Lead Time" (TTM), spanning from requirement identification to release.
Specifically, it measures the time during which tasks are in progress. If tasks are properly divided, Cycle Time should become constant, providing a reason to assess the development capacity and stability of the development process.
I learned about this metric for the first time during this research, but there are many sites dealing with it, and it seems to be a common one.
The diagram below is quoted from "Main Agile Software Development Metrics and KPIs". It represents average, rolling average, standard deviation, and cycle time all in one diagram.
A short cycle time indicates not only a high development capability, but also possibly results from the quality and effectiveness of the work processes, such as reduced rework due to quality issues, shorter wait times for tasks, and fewer context switches. On the contrary, deterioration in Cycle Time is also considered as a sign of potential issues with quality or processes.
Cycle Time aims to achieve "stability" and a "gradual reduction." There also seem to be cases where tasks for implementation and defect remediation are measured separately.
Mean Time to Repair (MTTR)
Average time to repair defects, calculated by Number of Defects / Coding Time for Remediation.
MTTR (Mean Time To Repair) is a well-known indicator that represents the maintainability of computer systems. It is used to measure the efficiency of the development team.
Here, it is categorized under "development capability," but it could also be considered as the possibility of a seamless process from issue detection to cause identification, repair, and testing, as well as highly maintainable products for which cause identification and repairs are easy.
This metric could also prove useful, it could be an indicator of issues or a basis for implementing countermeasures, for example like 'The decrease in MTTR with each version might be due to an increase in technical debt' or 'The quality is so bad that stopping new development and focusing on repairs should be considered.''
Progress
The metrics that can measure the progress of development are as follows:
- Burndown chart
- Test progress rate
Burndown chart
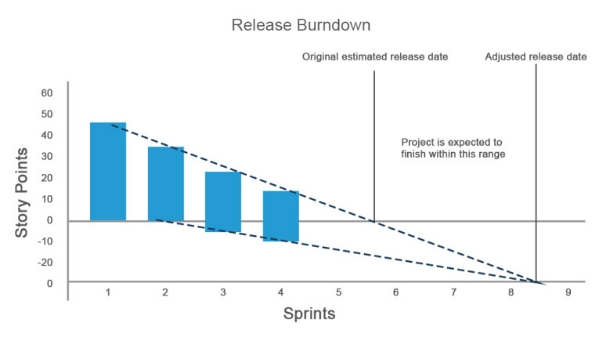
A typical method of monitoring progress is the a Burndown chart which visualizes the progress of tasks (The Burndown chart itself is not a metric, but...). By comparing the projected line and actual line calculated from the remaining days vs. work volume, progress can be understood and estimated completion can be determined. It has applications at both the sprint unit and the version unit.
It's important to visualize the "increase in total work volume during the course of development" as a point. For instance, if you have completed 10 SP of work in a day but for some reasons, an additional 10 SP of work is added, simply seeing that 'the graph is not decreasing' would be problematic. It's important to present visibly with "a descending line corresponds to completed portion" (The slope corresponds to Velocity) and "an ascending line corresponds to added portion" (Corresponding to total work each point in time).
As an alternative approach, there is also the method of "placing the added portion on the negative side of the bar graph." This might be more intuitively understandable.
The diagram below, similar to Cycle Time, is from "Main Agile Software Development Metrics and KPIs".
Furthermore, in Agile development, it is inevitable for scope changes to occur within a single development version. On the other hand, frequent scope creep within a sprint is not favorable. It is necessary to ensure that there are no problems in the requirement acceptance and task effort estimation.
Test Progress Rate
Monitoring the progress over time of the number of completed tests against the total number of tests.
It depends on the team whether it is managed at the same place as ticket management or managed separately using a testing tool.
Process
The metrics that can measure how good a process is are as follows:
- Task Status Distribution
- Release Overhead
- Flow Efficiency
- Predictability
Task Distribution Status
A representation of the Task's Status (for example, 3 types: todo, doing, done) that is color-coded and stacked (Cumulative Flow Chart or Cumulative Flow Diagram). The width of the 'doing' layer corresponds to the above-mentioned Cycle Time. Again, this is taken from "Main Agile Software Development Metrics and KPIs."
In a healthy situation, it is expected that the proportion of ‘done’ increases with time.
If the proportion of ‘doing’ has an upward trend, there might be process-related issues or a backlog is causing a blockage, preventing progress into the ‘done’ state. Or, having too many WIP (Work in Progress) tasks might lead to frequent context switches and a decrease in development efficiency. There's also a study (PDF) of the correlation between the team member's WIP (Work in Progress) count and defect leakage.
This too can be considered as a tool for early detection of problems.
If we divide graphs depending on the type of task into whether it's implementation, defect fixing, or environment creation, there can be new insights. For example, incident reports keep increasing, yet they never transition into the 'doing' phase...
Release Overhead
Represents the time and cost required for a release.
If you plan to regularly release in short cycles, minimizing the time and cost for that purpose is necessary. You can enhance process efficiency by discovering bottlenecks by measuring the time and cost during testing of the Release Candidate (RC) or the confirmation phase before the deployment.
Flow Efficiency
Indicates the ratio of actual working time and waiting time.
As tasks that depend on the completion of other tasks increase, the waiting time for the completion of prerequisite tasks also tends to become longer. Visualizing such inefficiencies, it allows the detection of process deterioration and bottlenecks.
Predictability
A meta-metric by observing the disparity between planned and actual values of each individual metric.
As I read various articles about metrics, I notice that ‘stability’ is recognized to be as important as ‘high development capability.’ How stable a process is and how high its estimation accuracy are referred to as 'predictability'.
Measure the magnitude of deviations from the plan and the standard deviation of actual values, then improve towards variation reduction. If the variation is low, the need for anticipated buffers will also decrease.
Quality
I originally started this investigation because I wanted to know about this.
The metrics that can measure the goodness of the quality are as follows:
- Code Coverage
- Code Complexity
- Code Churn
- Defect Density
- Defect Manifestation
- Defect Detection Percentage (DDP)
- Mean Time to Detect (MTTD)
- Test Success Rate
- Build Success Rate
Code Coverage
The definition in the ISTQB 2018 Syllabus (available for download here) is as follows:
“At the component testing level, code coverage is based on the percentage of component code that has been tested, and may be measured in terms of different aspects of code (coverage items) such as the percentage of executable statements tested in the component, or the percentage of decision outcomes tested.”
I think it is more commonly used as a necessary condition rather than a sufficient condition for quality.
Some organizations aim for 100% statement coverage and decision coverage, while some books suggest that 60% to 90% coverage is sufficient for typical commercial software. (60 to 90 is a wide range, but...)
Since there are several types of coverage, it's necessary to understand their meanings.
Code Complexity
It quantifies how complex the source code is.
If the code is complex, it's prone to embed defects, and testing also becomes complicated, leading to a deterioration in the quality of the product. Moreover, due to the same reasons, repairs become difficult, resulting in poor maintainability and affecting the long-term quality. Complexity can help identify high-risk code that is prone to embed defects, and can be used to prioritize code reviews and refactoring.
Examples of complexity include nesting depth, class coupling, McCabe's Cyclomatic Complexity, Halstead's complexity, and more. However, it's important to note that humans and machines perceive complexity differently. In a recent machine learning event, an industrial expert said "We use codes which are difficult for humans to read as training data, even if the code analysis does not judge them as complex."
Additionally, there are other code metrics such as code clones and security vulnerabilities, which are mainly detected using tools.
Code Churn
An indicator to observe the stability of the code for each development stage, based on information about how much code has been added, deleted, or modified.
In a Japanese article it is explained as follows:
“Files that have been edited multiple times by multiple people are likely to violate the ‘Single Responsibility Principle’ and for it to potentially contain bugs, as the code has been edited for multiple purposes.”
If there is an increasing trend (frequent code modifications), there may be a possibility of insufficient testing. Additionally, if there are numerous commits by multiple individuals just before the release, then there is a need to investigate the stability of that code.
Defect Density
Defect count per development scale (SLOC, FP, story points, etc.). It's a metric that tends to spark discussions even in waterfall development.
For instance, a notable drawback when using SLOC (source lines of code) as the denominator, there are times that it doesn't consider the difficulty of implementation or the complexity of the code. Rather than establishing a single criterion for a large organization and referencing that criterion across all projects, it seems better to observe trends within a single product. In the case of using SP as denominator, it might not be possible to compare with other teams in the first place.
Similar to velocity, if it's stable, it can be used for estimation and can also detect some anomalies.
Defect Trends
This applies not only to Agile development but is important to analyze defects from various perspectives. For example, classifications can be established based on the function and story, the importance, the quality attributes (functionality, performance, usability, maintainability, etc.), and the transition time between open and closed states.
However, judgment should not be based only on classifications and numbers. Once you identify a trend, it will be necessary to delve into the details of the bug reports in that area.
Also in Agile development, the shift-left approach is effective. The earlier you identify bugs, the lower the repair cost will be.
DDP (Defect Detection Percentage)
It is the ratio of defects identified during development out of all defects in the product. The higher the DDP, the better defects are being identified and addressed during the development process.
In the context of the Waterfall model, as per "Software Test Automation," there is a discussion about calculating DDP not only for the two phases of "during development" and "after release," but also for each testing phase during the development. For example, Integration Testing (80 defects) → System Testing (15 defects) → User Acceptance Testing (3 defects) → Release (2 defects), then you can calculate as follows.
- Test DDP = (80+15+3) / (80+15+3+2) = 98.0%
- Integration Testing DDP at the time of System Testing completion = 80 / (80+15) = 84.2%
I'm interested in knowing if there are any examples of effectively utilizing DDP in the context of agile development. I'm considering reinterpreting the testing phases above as sprints... although it doesn't seem like a suitable reinterpretation.
From the perspective of post-release defects, there are also websites that mention monitoring mobile app crash status using services like Firebase Crashlytics.
Mean Time to Detect (MTTD)
MTTR represents the maintainability of a system, whereas MTBF (Mean Time Between Failure) is a metric that expresses the reliability of a system.
In such analogy, MTTD (Mean Time To Detect) becomes the 'average time for a tester to encounter the next defect.' This depends on the quality and reliability of the product, but as well to the quality of testing and the capabilities of the testing engineers.
Test Success Rate
It is the ratio of successfully executed tests. Ideally, it should improve over time. If it's making little progress towards the end, there might be issues such as not being able to close defects, indicating a sign of danger.
Of course, there can also be issues on the testing side. Incorrect test expectations, broken tests, and so on.
Build Success Rate
It is represented by the likes of "days since the last build failure" and "number of consecutive build failures," becoming an indicator of the stability of the build process.
It leads to improvements from the perspective of ensuring that there are no issues in the code before entering the system testing phase and that there are no problems with the team's white-box testing approach.
Handling Metrics
Now, this isn't just limited to Agile methodologies, but when it comes to metrics, below are some important points to consider.
- Those receiving the reports should not use them for individual evaluations.
- Those providing the reports should not manipulate data to conceal issues.
- Avoid metrics that require excessive effort to collect. Strive to automate acquisition, aggregation, and presentation as much as possible.
Furthermore, it’s recommended in the slide deck below to divide short-term and long-term, and visualize it through dashboards.
View Slides by Gaetano Mazzanti on Slideshare
Examples of metrics are as follows:
- Short-term: Build Success Rate, Automated Test Success Rate, Burndown Chart, Added Critical Bugs, Unresolved Critical Bugs, and more.
- Long-term: Test Failure Rate, Number of Tests, Velocity, Bugs by Type, and more.
Conclusion
I've introduced them briefly, but what do you think?
Originally, since the motive was "metrics related to quality," there might be some bias. There are only two metrics that represent progress, and there is not one mention of cost-related metrics. Actually, I have read articles about attempts to apply EVM (Earned Value Management) in Agile, but I have omitted them.
I would also like to learn about the nice metrics that your teams are using. Especially in terms of quality!
Learn More
Below are useful resources that I didn’t directly reference the following articles and materials in my article.
- Agile Testing Metrics to Measure the Performance of Software Testing Process by ReqTest
- 3 KPIs Used to Measure the True ROI of Agile Testing by Francis Adanza
- Agile Metrics and Quality by Anu Khendry
- The AgileSparks Way of Measuring Improvement on the Agile Journey/Transformation from AgileSparks
- Getting to Simple Lean/Agile KPIs by Yuval Yeret
- Five Agile Metrics You Won't Hate by Dan Radigan
- 7 Software Quality KPIs in Agile Development Projects by TestDevLab
- Flow Efficiency: A Great Metric You Probably Aren't Using by Julia Wester
- Scrum Metrics by Bob Boyd
- Measure and Grow by Scaled Agile Framework
- Software Testing Metrics and KPI by Onur Baskirt
- What Makes a Good QA Tester? 4 KPIs Essential to Software Testing by Ori Bendet
- Agile Metrics by John Kammelar
Note: This article was originally published in Japanese here and was translated with permission from the original author.
MagicPod is a no-code AI-driven test automation platform for testing mobile and web applications designed to speed up release cycles. Unlike traditional "record & playback" tools, MagicPod uses an AI self-healing mechanism. This means your test scripts are automatically updated when the application's UI changes, significantly reducing maintenance overhead and helping teams focus on development.
